Showing posts with label progressivity. Show all posts

Monday, April 12, 2010

What Krugman gets wrong on Social Security taxes…

Over at AEI's enterprise blog I write:

Paul Krugman, responding to folks who pointed out that having nearly half the population not pay income taxes might not be quite right, says

"The thing to bear in mind is that overall, the US tax system isn't actually that progressive: the payroll tax is regressive, as are most state and local taxes, which largely offsets the progressivity of the income tax."

I'll limit myself here to payroll taxes. (It's not clear to me that state income and property taxes are regressive, although sales taxes are.) Social Security taxes, as Krugman may or may not be aware, fund a thing known as Social Security benefits. Analysts of this system consider them together in order to determine whether the program is or isn't progressive.

One way they do it is by calculating what's called the "net tax rate"—that is, the statutory 12.4 percent Social Security tax paid by workers minus the benefits they receive from the program. If you receive benefits equal to your taxes, then your net tax rate is zero. If you pay more in taxes than you receive in benefits, your net tax rate is positive; likewise, if you receive more benefits than taxes your net tax rate is negative.

This chart, which I calculated using the Policy Simulation Group's GEMINI model, reports net tax rates for recent retirees, broken down by quintiles of lifetime earnings. What it shows is that the highest-earning 20 percent of individuals—the fifth quintile—pay a positive net tax rate of 3 percent of lifetime earnings.


The other 80 percent pay negative net tax rates, meaning that they tend to receive more in benefits than they receive in taxes. (For anyone looking forward to this in the future, just bear in mind that the program is insolvent.) The lowest-earning fifth of the population has a negative net tax rate of almost 27 percent, which implies that they receive far, far more from Social Security than they pay into the program.

Call me picky, but what I'd like to see from tenured Ivy League professors and Nobel Prize winners is that it takes more than, oh, 30 seconds to figure out the obvious flaw in their arguments. Maybe next time.

Here's another way to put it: if we're looking at Social Security taxes and benefits in isolation, then yes, Social Security taxes are regressive. But then, Social Security benefits would have to be considered a form of welfare, rather than earned social insurance. The key to the program from FDR's time, I've argued, was that there was some link between the two. If so, we should think about them in those terms.

Read more!

Wednesday, January 20, 2010

U.S. News: 8 Possible Changes to Social Security Benefits

U.S. News & World Report's Philip Moeller reports on potential benefit changes that could improve treatment for low earners under Social Security, discussed in a recent GAO report. Here's the short list with some of my comments on each – you'll have to read the article for the details (which are good).

  • Guaranteeing a Minimum Benefit.
    • Most benefit guarantees, for instance, don't do a heck of a lot because not many people are eligible. The problem for an earnings-based system like Social Security is that as you move to ensure a minimum income for truly low earners you end up shifting much closer to a "welfare program" that breaks the earnings-benefit link. That already occurs to some degree already through Social Security's progressivity, but to reach the truly poor in retirement you have to target people with very spotty work records. That's a tricky path, both in policy and political terms.
  • Reducing Work Requirements for Eligibility.
    • I wrote on this subject for NASI last year and was a bit disappointed in the results. There aren't a ton of non-immigrants who benefit from reducing the current 10-year work requirement to qualify for retirement benefits. I'm all for lowering the work requirement, since this doesn't result in any sort of giveaway since Social Security doesn't really have a minimum benefit, but I don't think it will produce all that much.
  • Supplementing Benefits for Low-income Single Workers.
    • I'd rather reduce spousal benefits, which are an unearned (and often unneeded) subsidy for married couples, then use the savings to boost benefits overall at the low end. We need less complexity rather than more.
  • Adopting Earnings Sharing.
    • I'm very interested in this idea, in which total household earnings would be split evenly between spouses each year for the purposes of calculating their future benefits. I've not seen it modeled very closely, so there may be some things that I haven't thought about, but in the big picture the household is the relevant unit so I think that's what we should be looking at.
  • Reducing the Marriage Duration Required for Spousal Benefits.
    • I ran some numbers a few years ago on lowering the current 10-year marriage requirement to be eligible for divorced spouse benefits and it seemed like a cheap but pretty well targeted reform; that is, it increased benefits principally for people with very low lifetime earnings. Since the typical divorce takes place before 10 years of marriage this might make sense, although I'd probably prefer something like earnings sharing.
  • Providing Caregiver Credits.
    • I've read differing accounts of how well caregiver credits would work; one problem is that low-income people have to work and can't afford to stay home, so the targeting may not be great unless it's limited to low earners. It would also weaken the earnings-benefits link, although it's often pretty weak in any case.
  • Increasing Survivor Benefits.
    • When one spouse dies total household Social Security benefits are reduced by one-third to one-half, depending on the distribution of benefits between spouses. Using a standard approach for calculating efficiencies of scale in household size, a household of one has costs equal to around 63% of a household of two. A benefit reduction of one-third may be ok, but one-half seems too much.
  • Providing Longevity Insurance.
    • Social Security already provides significant longevity insurance, particularly for low earners who derive most of their retirement income from the program, but higher earners may desire more. Increasing benefits later in life might help compensate for the fact that most non-Social Security sources of income aren't indexed to inflation and thereby help smooth income better over the course of retirement.

I'm ok on pretty much all of these, at least in some form, although some would work better than others.

Read more!

Thursday, June 18, 2009

Testimony and video from Senate Aging Committee hearing on Social Security reform

Yesterday the Senate Aging Committee held a hearing on Social Security reform, with an emphasis on changes that could improve benefit adequacy for vulnerable populations. Following are the statements of the Chair and Ranking Member, then witness testimony:

Statements of Committee Members

Witness Testimony

  • Leon Burzynski,, President, Wisconsin Alliance for Retired Americans, Pewaukee, WI
  • Kenneth Apfel, Professor of the Practice, School of Public Policy, University of Maryland, College Park, MD
  • Joan Entmacher, Vice President for Family Economic Security, National Women's Law Center, Washington, DC
  • Melissa Favreault, Senior Research Associate, Income and Benefits Policy Center, Urban Institute, Washington, DC
  • John Irons, Research and Policy Director, Economic Policy Institute, Washington, DC
  • Andrew Biggs, Resident Scholar, American Enterprise Institute, Washington, DC
Click here for video of the hearing.

Read more!

Wednesday, April 15, 2009

How does Social Security affect tax progressivity?

The Economist weighs in on tax day on how the Social Security program affects the overall progressivity of the tax code. People on the right often point that that the vast majority of income taxes are paid by high earners. On the left, however, folks point out that payroll taxes are a large and regressive tax that often isn't included in these kinds of analysis. That's a fair point. However, as I discussed here, Social Security is a program in which taxes and benefits are linked. And low earners generally receive more benefits relative to their taxes than do high earners. So the progressivity of the benefit formula needs to be factored in.

This chart shows the lifetime net Social Security tax rate paid by current retirees of different earnings levels. The net tax rate reflects the legal tax rate – 12.4 percent of earnings – minus the benefits generated by those taxes. If you received lifetime benefits equal to 12.4 percent of your lifetime earnings, for instance, your net tax rate would be zero. If you received even more than that, your net taxes would be negative – this means that you receive a subsidy from the program.

As the chart shows, for low earners the net tax rate is highly negative, meaning that they receive significantly more from the program than they pay in. Subsidies are smaller for middle earners, and non-existent for individuals in the top 20 percent of the earnings distribution.

Read more!

Tuesday, January 27, 2009

New paper: “A Progressivity Index for Social Security”

I have a new paper out through the Social Security Administration co-authored with my SSA colleagues Mark Sarney and Chris Tamborini called "A Progressivity Index for Social Security." The goal of the paper was to find better descriptive measures of redistribution within Social Security. Here's the abstract followed by a quick explanation:

Using the Social Security Administration's MINT (Modeling Income in the Near Term) model, this paper analyzes the progressivity of the Old-Age, Survivors and Disability Insurance (OASDI) program for current and future retirees. It uses a progressivity index that provides a summary measure of the distribution of taxes and benefits on a lifetime basis. Results indicate that OASDI lies roughly halfway between a flat replacement rate and a flat dollar benefit for current retirees. Projections suggest that progressivity will remain relatively similar for future retirees. In addition, the paper estimates the effects of several policy changes on progressivity for future retirees.

The key approach was to calculate the percentage of total benefits received by individuals paying a given percentage of total taxes. Here's a chart which helps explain things. The horizontal axis shows the percentage of total lifetime taxes paid by members of a given birth cohort, while the vertical axis shows the percentage of total lifetime benefits received. For instance, we can see that individuals paying the bottom 50 percent of total taxes receive around 61 percent of total benefits. This indicates that the program is progressive, if modestly so.

Using these curves, we calculate a single summary measure based on the Gini coefficient. A system with no redistribution – meaning that people received benefits exactly in proportion to their contributions – would have a progressivity value of zero. Similarly, a system in which everyone received the same flat dollar benefit regardless of contributions would have a progressivity value of around 0.33. The progressivity value for current law Social Security is around 0.16, leading us to conclude that Social Security is (very roughly) around half way between a pure defined contribution program and a flat dollar benefit in terms of its progressivity.

We also calculate how Social Security progressivity has changed over time, and how common Social Security reforms might alter overall system progressivity. There's some interesting stuff here, and thank my co-authors for all their hard work.

Read more!

Wednesday, January 14, 2009

New paper: “Will Your Social Insurance Pay Off? Making Social Security Progressivity Work for Low-Income Retirees”

I have a new paper up in AEI's Retirement Policy Outlook series called "Will Your Social Insurance Pay Off? Making Social Security Progressivity Work for Low-Income Retirees." Here's the summary followed by some comments:

Although the Social Security program is progressive--meaning that the replacement rate of preretirement earnings offered by Social Security tends to rise as lifetime earnings decline--this relationship is erratic. While individuals with lower lifetime earnings receive better treatment on average, lifetime earnings are only a weak predictor of how any one person will be treated by the Social Security program. Many high-earning households receive high replacement rates, and many low-earning households fail to receive them. Thus, Social Security is not entirely effective as a social insurance program protecting low lifetime wage earners against a meager retirement. In order to make Social Security more reliably progressive--thus protecting low-earning workers and allowing them to plan more effectively for their financial future--one possible approach would be to offer a flat dollar benefit for each retiree along with an individual account whose benefits are tied directly to contributions.

A few charts give a feel for the main points, which I think are pretty important in policy terms. This first chart shows median Social Security replacement rates by lifetime earnings percentile. The slope of the line is negative, which means that as your lifetime earnings rise your replacement rate tends to fall. In other words, Social Security is progressive, on average.

But only on average. The second chart shows actual data points for couple's replacement rates, taken from the GEMINI microsimulation model. Even if the system is progressive on average, there's a ton of variation in replacement rates even for couples with the same lifetime earnings. The reason is there are a ton of pieces of the benefit formula – wage indexing of earnings; the 35 years averaging period for earnings; the 10-years required for benefit eligibility and divorced spouse benefits; the 50 percent spousal benefit; the tax max, etc – that can make benefits very different even for individuals or couples with the same earnings level.

There are a lot of low earners who receive low replacement rates, and a lot of high earners who receive high replacement rates. What's more, the variation in replacement rates rises for lower income people, who are precisely the ones who need social insurance the most. In other word, for low earners Social Security is like a home insurance policy that may or may not pay off if your house burns down – and sometimes pays off even if your house doesn't burn down.

But now check out the third chart. This shows results from a stylized reform plan: every retiree receives a flat dollar benefit of $600 per month from Social Security. In addition, every worker has a personal account in which they save 3 percent of their earnings; these are invested only in government bonds. The key thing here is that average benefits are around the same as Social Security, and average progressivity is also around the same (meaning the slope of the line is the same, although extremely low earners do receive higher replacement rates here than Social Security). What's different is that there's much less variation in replacement rates: low earners consistently receive high replacement rates, and high earners consistently receive low replacement rates.

What this shows is that for the purposes of social insurance, sometimes too much complexity actually makes things worse. A very simple and understandable reform plan can accomplish the social insurance purposes of Social Security better than current law.

Read more!

Monday, December 29, 2008

Is the Social Security tax regressive once you account for benefits?

It's sometimes argued that, while income taxes are progressive, the progressivity of the total tax code has to be viewed inclusive of payroll taxes, which are either flat (in the case of the 2.9% Medicare tax) or regressive (in the case of the 12.4% Social Security tax, which applies only to the first $106,000 in earnings). It's not always clear from these statements what the net effect is.

A new CBO letter allows for a better view of this, although even this doesn't tell the whole story (as I'll discuss below). The picture below first shows effective income tax rates by income quintile, for people in 2005. As you'd expect, they're pretty progressive, and the poorest 40 percent of Americans pay negative rates through policies like the Earned Income Tax Credit.

The next picture shows effective social insurance – Social Security and Medicare – tax rates, also by income quintile. While rates are somewhat progressive through the fourth quintile, they decline for the top quintile because of the cap on Social Security taxes.

If we add social insurance and income taxes, along with corporate income and excise taxes, the next picture shows total effective federal tax rates. As you can see, even if we add social insurance taxes, the overall tax code is still reasonably progressive (in my view; others may defined reasonable differently).

But below is a chart I've constructed from a different data source, the GEMINI model of Social Security financing. The key issue with Social Security taxes is that while the tax itself is regressive, the benefits are progressive. Since taxes pay for benefits, you want to look at the progressivity of the Social Security program as a whole. The chart below is for individuals retiring in the 2030s, although they would not be much different for people retiring earlier or later (it's just the data I had lying around…). I've calculated effective payroll tax rates by lifetime earnings quintile, which means the payroll tax paid minus the disability and retirement benefits the individual receives. If you received benefits exactly equal to your taxes (plus interest at the government bond rate) then your net tax would be zero. Although net tax rates are always lower than the statutory 12.4% rate, at least for people (as here) who survive to retirement, the distributional picture is very different.

The highest quintile of lifetime earners pays a net tax of around 3 of earnings. This implies that they pay 12.4% of wages while working, but then receive benefits back equal to around 9.4% of wages. While this isn't a great deal – in a fully funded system they'd receive back everything they paid in – it's better than paying 12.4% and getting nothing back.

But notice what happens as lifetime earnings decline. Net tax rates are negative, meaning that (under current law benefits, at least) most folks would get out more in benefits than they pay in taxes. For the lowest earners, net taxes are very negative, around -27 percent. This means that on average these folks receive about three times more in benefits than they pay in taxes. Remember this the next time someone says that the Social Security tax is regressive: sure, it is, but things look very different when benefits are counted into the picture.

As a P.S., why are net tax rates more negative for the middle quintile than for the second quintile? The answer to that is, I don't know – although because this data output mixes both retirement and disability benefits, it should be possible to disaggregate them and get a better feel for things.

Read more!

Monday, December 8, 2008

Does Social Security actually spread risk across generations?

Two of the better arguments for the Social Security program are the ability of a government-run program to spread risk both within and between generations. Spreading risk within a generation means redistributing from higher to lower-earning members of the same birth cohort. Spreading risk across generations means redistributing from relatively high earning birth cohorts to relatively low-earning ones. Both of these risk sharing functions are potentially very valuable, yet neither is easily accomplished through private markets. This creates a potentially strong argument for a pay-as-you-go program like Social Security: it can do things that a simple forced savings plan couldn't do.

I've recently been doing some work on the ability of Social Security to spread risk within generations. (I'll have an AEI paper out on that shortly, or you can click here for a preview of some of the basic thoughts.) Intra-cohort risk – the risk of having low earnings relative to other members of your cohort – is addressed through a progressive benefit schedule. Individuals with low lifetime earnings receive higher benefits relative to their earnings – a higher "replacement rate" – than do higher earners. However, as this chart shows, there's actually a lot of variation in replacement rates even for people with the same earnings, due to quirks in the benefit formula. As a result, Social Security's "insurance" against relatively low earnings doesn't work nearly as well as it could.

But here I'm interested in looking at Social Security's ability to spread risk across generations. Social Security is often called a "compact between generations." As a pay-as-you-go program, in which each working generation funds the retirement benefits of the generation that preceded it, Social Security could in theory smooth transfer resources between richer and poorer generations. A relatively poor generation, for instance, would be subsidized by a relatively rich generation that followed. The risk that you'll belong to a relatively poor generation – one that lives through times in which average earnings and economic growth are low – can't be diversified away through any ordinary means of investment or insurance.

So Social Security can accomplish intergenerational risk sharing in theory. But does it do so in practice? I don't think so. Here's why.

Under Social Security, average retirement benefits for a given cohort are calculated based on average wage growth during that cohort's working years. Here's how it works: when you retire, your past earnings are "wage indexed" to the year you turned 60. For instance, if you earned $10,000 at age 25 and average wages economy-wide grew by 3 percent annually from that year through age 60, then that $10,000 wage would be "indexed" to $28,139. This process is followed for all your past wages, which are then averaged. For the typical worker, Social Security pays a benefit equal to around 40 percent of the average indexed wages. The key here is that your retirement benefit depends both on your own wages and on the growth of average wages in the economy. The faster average wages grew during your working years, the higher your own benefit will be in retirement. The rate of average wage growth is like an interest rate that's paid on your past earnings and Social Security contributions.

But here's the problem: the earnings of future workers have no effect on the benefits owed to contemporaneous retirees. Wage growth for Generation B play no role in the benefit calculation for Generation A. For instance, imagine that average wages grew only 1 percent annually during your working years, but that in the year you claimed benefits wage growth took off and continued at a 5 percent rate throughout your retirement. Unfortunately, you would not share in any of that wage growth.

So it seems that in ordinary circumstances Social Security doesn't do much to spread aggregate earnings risk between generations. It may be financed cross-generationally, but the benefits a given generation is entitled to aren't dependent on the earnings of following generations.

Would it be possible for Social Security to spread risk more effectively between generations? Yes. Consider a reform plan where retirees receive a benefit equal to a given percentage of the average wage at the time. For instance, retirees in 2008 might receive a benefit equal to 25 percent of the average wage earned by workers in 2008. This would produce an annual benefit about equal to the benefits received under current law. However, the benefits received by retirees in 2008 would depend on average earnings in 2008, not on the retirees average earnings during their working years. If earnings rise more rapidly, that extra wage growth will be shared with current retirees. But if earnings grow only slowly, retirees will also share some of that pain.

The advantage here is diversification: most retirees will have some non-Social Security savings, the level of which depends on how much they earned while working and on the interest rates their investments received. Deriving part of their retirement income from a different source, the earnings of future workers, allows them to diversify against the risk of their birth cohort having low earnings growth or receiving poor returns on their investments.

But again, it appears that current law Social Security doesn't really take advantage of this opportunity to smooth risk across generations.

Read more!

Tuesday, November 25, 2008

New Paper: “Are There Opportunities to Increase Social Security Progressivity despite Underfunding?”

The Tax Policy Center has released a new paper by the Urban Institute's Melissa Favreault and Gordon Mermin titled "Are There Opportunities to Increase Social Security Progressivity despite Underfunding?" Here's the abstract:

This paper reviews why Social Security fails to lift more aged low-wage workers and people of color out of poverty. It examines the payroll tax and benefit formula and reviews literature about OASDI outcomes by race, gender, and earnings level. It describes how mortality, earnings, disability, childbearing, immigration and emigration, and marriage patterns all differ across U.S. racial/ethnic groups, and highlights the importance of these differences for program outcomes. The paper then uses the DYNASIM model to examine lifetime OASDI redistribution under current law and a trust fund-neutral reform package that would enhance system progressivity and improve outcomes for some vulnerable to retirement poverty.

In addition to being a good summary of existing research on who does well and who does poorly under Social Security – and why – Favreault and Mermin present a number of potential reforms to Social Security to reduce poverty among seniors. Definitely worth a read.

Here's my quick take, based on forthcoming work for AEI: while Favreault and Mermin's paper is very good, the emphasis on whether Social Security should be more or less progressive actually misses the point a bit. The problem Social Security faces is that it isn't consistently progressive, meaning that there is too much disparity in treatment among people with the same lifetime earnings. Poor people get higher average replacement rates than higher income people, but that average hides a lot of disparity: many poor folks do really well, but a lot also do pretty poorly. The reason, as Favreault and Mermin point out, is that Social Security redistributes based on a lot of factors other than the person's lifetime earnings. (E.g., length of marriage, relative earnings between spouses, length of working career, etc.)

The chart below illustrates. As can be seen, average replacement rates decline as lifetime earnings increase – this shows that Social Security is generally progressive. However, the distribution of replacement rates at any given level of lifetime earnings can be pretty wide, especially for low earners. Some do really well, others do pretty poorly.

If Social Security is to be successful as social insurance, it needs to pay off consistently. There are a number of ways, including those discussed by Favreault and Mermin, to improve the targeting of Social Security benefits by earnings level. If Social Security's progressivity were better targeted, the same amount of average progressivity could produce better protections for low earners in old age.

Update: An anonymous commenter asks, "The problem you note may be related to the disparate way benefit formulas apply to couples in general. The chart would probably look more equitable for wage earners only. Is the way we treat couples still as relevant as it was in the 1930's?"

It's a logical point but turns out not to be the case. Social Security benefits are better targeted at a household level than an individual level. The chart below differs a bit from the one above (it shows data points rather than interquartile ranges), but the dispersion in replacement rates by lifetime earnings is significantly higher at the individual than the household level.

One way to look at is to measure the R-squared values of a regression of replacement rates on lifetime earnings. At the household level the R-squared value is around 0.55, which indicates that around 55% of differences in replacement rates can be accounted for by differences in lifetime earnings. (Given that Social Security is designed to redistribute by lifetime eranings, this strikes me as a lower value than you'd want.) At the individual level, however, the R-squared is only around 0.3; this indicates that 70 percent of differences in replacement rates between indivduals are due to things other than differences in their lifetime eranings. This again strikes me as very haphazard given that we're trying to target low earners.

Read more!

Monday, October 20, 2008

Obama: Tax cuts or welfare?

There's been a fair amount of ink spilled on whether Sen. Obama's claim that he would give tax cuts to 95 percent of Americans is legit. The key point is whether a transfer made to an individual who does not currently pay income taxes can be counted as a "tax cut."

The core component of Sen. Obama's tax cut plan is called "Making Work Pay." I've discussed it elsewhere, but the key claim is that it provides a $500 refundable income tax credit for each worker, for a maximum of $1000 per couple. The Tax Policy Center estimates its 10-year cost at $710 billion, so it's obviously a big-ticket item in Obama's tax agenda.

So here's the question: how should we categorize these policies?

The Tax Foundation reports that 33 percent of filers currently pay no net income taxes, which means that 67 percent of filers do. Since 95 percent is larger than 67 percent, it's seemingly hard for Sen. Obama to argue that 95 of Americans will receive a tax cut when only 67 percent are paying taxes in the first place. The Wall Street Journal editorial page relies on this argument in calling Obama's claims an "illusion."

But note that the references above are to the percentage of Americans paying income taxes. Most or all of the tax filers who do not pay income taxes do pay payroll taxes for Social Security and Medicare. Obama's plan is clearly designed to compensate workers for the employee share of the Social Security payroll tax, which is 6.2 percent of all wages under $102,000. Under Obama's plan, workers would receive a refundable tax credit equal to 6.2% of wages up to $8,000, with a maximum credit of $500 per worker and $1,000 per couple. In effect, workers earning $8,000 would receive a full rebate of their Social Security payroll taxes while those earning more would receive a partial rebate. Obama economic advisor Jason Furman says, "Senator Obama believes that the tens of millions of families working hard and paying payroll taxes do not think that tax cuts are a form of 'welfare' or 'redistribution' - they think it is only fair to reward work."

Having laid that out, a few points seem relevant:

  • In a purely technical sense, Sen. Obama's plan is not giving tax cuts to people who don't pay taxes; it's giving refundable income tax credits to compensate low earners for their Social Security payroll taxes. So score one for Obama, I guess.
  • However, Obama's proposal ignores what's really going on: cutting Social Security payroll taxes for low earners, who already receive more in benefits than they pay in taxes – that is, their "net taxes" are negative – and filling the gap in Social Security's funding using income tax revenues. That's the clearest explanation of what's going on and would be the simplest way to structure what Obama wants to accomplish. If Obama wants to cut payroll taxes, he should cut payroll taxes – without obscuring the effects of his plan on both Social Security progressivity and solvency.
  • The only problem is that, viewed transparently, almost no one would agree that it's particularly good policy – certainly not a policy worth $710 billion over 10 years, given everything else on our plate. His plan would make Social Security much more progressive and move it toward a "welfare program." And if we didn't fill the gap with income tax revenues, Social Security's long-term deficit would be increased by almost 60 percent.
Read more!

Thursday, October 9, 2008

How Obama would change effective payroll tax rates and Social Security progressivity?

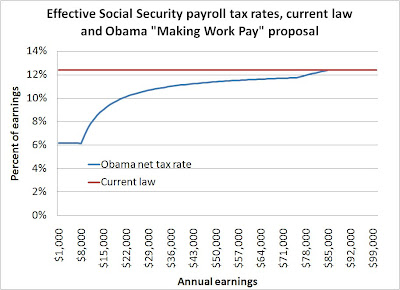
This hadn't gotten much discussion to date, but Sen. Obama has a component of his tax plan – called "Making Work Pay" – that would introduce significant progressivity into the tax side of Social Security. His plan is designed to partially or fully compensate workers for the employee share of the Social Security payroll tax – 6.2 percent of the 12.4 percent total tax. Workers would receive a refundable tax credit equal to 6.2% of wages up to $8,000, with a maximum credit of $500 per worker and $1,000 per couple. This is the source of the "tax cuts" Obama references for lower and middle income households. The Tax Policy Center assumes the credit phases out at 5 cents for each dollar of earnings above $75,000, meaning it declines to zero at $85,000.

How does this change the effective Social Security payroll tax rate? The chart below shows the net payroll tax as a percentage of earnings for a single worker, with earnings levels from zero to $102,000 (the current cap on payroll taxes). The net tax rate is 6.2 percent of wages up to $8,000, gradually increasing to the statutory rate of 12.4 percent of wages by $85,000 and remaining constant up to the cap.

How would this affect the progressivity of the Social Security program taken as a whole? Remember, while the Social Security payroll tax may be regressive – a fact those on the left often cite – Social Security benefits are progressive. So you need to look at both taxes and benefits together to understand the progressivity of both current law Social Security and the program net of Sen. Obama's new tax credit.

Commonly Social Security progressivity is described through what is called the "money's worth ratio," which is the ratio of lifetime benefit received by a given individual to lifetime taxes paid. Both taxes and benefits are expressed in present value form, by discounting them at the government bond rate. To put things in terms of rates of return, a money's worth ratio of 1, in which lifetime benefits are equal to lifetime taxes, implies that the individual earned a rate of return on their payroll taxes equal to the return on government bonds.

Social Security's actuaries periodically calculate money's worth ratios for stylized workers at different earnings levels. The data used here come from a 2007 publication and are for single earners retiring in 2008. The SSA actuaries use four stylized lifetime earnings levels. They are:

Very low: Earns around 25 percent of the average wage, or around $10,500 per year. Around 20 percent of workers are in this group (meaning that this is the closest descriptor of their average earnings).

Low: Earns around 45 percent of the average wage, or around $18,900 per year. Around 22 percent of workers are in this group.

Medium: Earns around 100 percent of the average wage, or around $42,000 per year. Around 28 percent of workers are in this group.

High: Earns around 160 percent of the average wage, or around $67,000 per year. Around 21 percent of workers are in this group.

Maximum: Earns the maximum taxable wage each year, or around $102,000. Around 10 percent of workers are in this group.

The following table compares the money's worth ratios for each worker type, assuming retirement at age 65 in 2008, to what they would have been under the Obama proposal.


Net money's worth ratio

Earnings level

Current law

Obama payroll tax rebate

Very low

1.19

1.88

Low

0.87

1.1

Medium

0.64

0.71

High

0.53

0.56

Maximum

0.47

0.47

Assumes single male worker, retiring in 2008 at age 65

For instance, under current law a very low earner could expect to receive 1.19 times more in lifetime benefits than they pay in lifetime taxes. Since this comparisons are made to present values, discounted at the government bond rate of return (around 3 percent above inflation), this implies a rate of return on payroll taxes of around 4 percent above inflation. Under the Obama proposal, the net money's worth ratio for a very low earner would increase to around 1.88; total benefits would be the same, but lifetime taxes would be significantly lower. While comparisons are not straightforward, this implies an annual return on taxes of around 6.1 percent above inflation. Over a lifetime, the differences are significant.

The chart below uses the data above shows the "slant" of the Social Security program's progressivity under the Obama proposal. As can be seen visually, the system would be significantly more progressive than under current law. This may or may not be a good thing, according to your perspective, but it seems not to be something that should go undiscussed.

Now, what would the effect of the Obama plan be on Social Security's financing? After all, it effectively rebates part or all of the employee share of the Social Security payroll tax. The answer is that technically it would not affect Social Security's financing at all. These rebates, while based on the Social Security payroll tax, would be paid from general tax revenues – broadly speaking, income taxes. The total general revenue cost of the Obama proposal over 10 years is $728 billion, according to the Tax Policy Center.

That said, it's worth comparing the cost of Obama's proposal to those for personal retirement accounts, whose "transition costs" would also would be funded out of general revenue. The last detailed analysis of President Bush's personal accounts proposal I've seen was for the 2007 budget, which forecast a 10-year total cost of around $779 billion. In other words, the two policies cost around the same in the short term. Over the long-term, however, the Bush plan was designed to save those early contributions to help reduce Social Security costs. In other words, almost every dollar of costs in the near term was recouped in later years. The Obama plan, however, is simply an effective reduction in payroll taxes which would have increased costs over the long term.

Note that these numbers omit any reference to Sen. Obama's formal Social Security plan, which would also increase progressivity by imposing a surtax of 2 to 4 percent on all earnings above $250,000. Together, these policies would significantly alter Social Security's progressivity and – some might argue – shift it closer to a welfare-type program.

Read more!

Monday, July 21, 2008

Would raising the retirement age be regressive?

It's sometimes commented that increasing the Social Security retirement age would be regressive. This makes sense at first glance, since lower earners tend to have shorter life spans that higher earners. However, an increase in the normal retirement age is equivalent to an across the board benefit cut – for each year the retirement age rises, benefits are reduced by around 6.7 percent. So there's no particular reason to think raising the retirement age would be any more regressive than any other benefit cut.

However, to check it out further I did a quick run using the Gemini model, where I compared replacement rates (annual benefit divided by an annualized income derived from the present value of lifetime earnings) by lifetime earnings percentile. I calculated replacement rates for current law and for a policy that would eliminate the hiatus in the retirement age increase from 66 to 67, and further raise the retirement age to 70 by the year 2060. (Although I examined the policy for the 1960 birth cohort, meaning their retirement age would not have risen all the way to 70 by the time they retired.)

The figure below compares replacement rates by earnings percentile for current law and an increased retirement age.

While this isn't decisive, visually there doesn't appear to be any strong deviation by earnings level. (Bear in mind that while the sample population was over 47,000, when examined by individual earnings percentile sample sizes were smaller.) There are other ways to calculate things, but at this point this seems to confirm my prior belief that progressivity wouldn't change very much.

Read more!

Sunday, July 13, 2008

Progressivity versus generosity around the world

Looking around the world, some government pension plans pay high benefits (with high contribution rates). These plans tend not to be very progressive. Likewise, plans paying lower average benefits tend to be more progressive. I've put together a chart below based on data from the OECD, where the average replacement rate is on the vertical axis and the level of progressivity is on the horizontal axis. (Progressivity runs from 0, which implies a totally earnings related plan, to 100, which implies a flat dollar benefit for everyone, regardless of earnings.) You can see visually, and a quick regression confirms, that the two are highly correlated: about half the difference in the size of a program can explained by looking at the progressivity of the program.

The Netherlands, for instance, is both the most generous but the least progressive of the 19 OECD countries listed. The U.S. is around the middle of the pack: it's ranked 7th in terms of progressivity and 13th in terms of generosity. (If you invert the generosity scale, the U.S. is ranked 6th, matching it up closely with its progressivity rank.)

I had played with this data a couple years ago, but thought of it again when I spotted a new paper entitled "Why are More Redistributive Social Security Systems Smaller? A Median Voter Approach," by Marko Koethenbuerger, Panu Poutvaara, and Paola Profeta. (The published paper is behind a firewall, but a working paper version is available here.) Here's a key paragraph:

Countries with earnings-related public pension programs have considerably higher contribution rates than those with flat-rate benefits. Disney (2004) reports that the effective contribution rates in the 10 OECD countries dominated by flat-rate systems varied between 14.7 percent in Australia and 23.7 percent in the United Kingdom in 1995. The range in the 12 OECD countries with more earnings-related benefits was between 22.4 percent in Germany and 57.7 percent in Greece. The average effective contribution rate was 19 percent in countries with flat-rate benefits, and 35 percent in countries with earnings-related benefits.

Here are their concluding remarks:

The relationship between the level to which benefits depend on past earnings and Social Security contribution rate has received little attention in the political economy literature, despite its robustness. In this paper, we suggest an explanation based on a standard trade-off between economic efficiency and redistribution. The efficiency cost of redistributing income is lower when benefits are earnings-related, encouraging voters who benefit from Social Security to support higher contribution rates. Low income voters weigh this effect against the reduced redistributiveness of more earnings-related systems. Our numerical analysis of several European countries suggests that the median voter model is able to explain the stylized fact that intragenerationally more redistributive social security systems are smaller.

The social security contribution rates predicted by the median voter model also have a strong correlation with the effective rates calculated by Disney (2004). This means that our median voter model is able at least in part to explain the levels of contribution rates and their cross-country differences. Even though our analysis focuses on steady-state political equilibria, our main result that benefit formula significantly affects political equilibrium contribution rates can be expected to hold also outside of steady-states. This suggests that the political response to population aging may crucially depend on to what extent benefits are linked to past contributions.

This last sentence is important, as Social Security proposals on both sides tend to make the system more progressive. Sen. Obama would increase taxes on high earners while implementing a tax credit to effectively lower payroll taxes for low earners. On the GOP side, most plans focus on reducing benefits for high earners, such as through "progressive price indexing." Social Security's progressivity hasn't changed a lot over the system's history, and it will be interesting to see how these proposals might alter political support for the program.

Read more!